Energy Data & Services

Energy data, prices, and fundamentals all from one trusted source. We make getting commodity data into your workflows easy.
Energy Prices and Data
| Content | Source | Region | Country |
|---|---|---|---|
| Canadian Rack Prices | Barchart | EOD | CA |
| Commodity3 | Commodity3 | Realtime | US |
| Commodity3 Bunker Prices | Commodity3 | Realtime | US |
| Crude Oil Indexes | Barchart | EOD | US |
| Crude Oil Postings | Barchart | EOD | US |
| EOX Crude Oil Forward Curve | EOX | EOD | Global |
| EOX Natural Gas Forward Curve | EOX | EOD | Global |
| EOX Refined Products Forward Curve | EOX | EOD | Global |
| Evolution Markets Nuclear Fuel Prices | Evolution Markets | EOD | US |
| Evolution Markets USA Coal Prices | Evolution Markets | EOD | US |
| PanXchange Frac Sand Prices | PanXchange | EOD | US |
| Prima Markets Global Biofuel Prices | Prima Markets | EOD | Global |
| Prima Markets Low Carbon Fuels and Feedstocks | Prima Markets | EOD | Global |
| Retail Fuel Indexes | Barchart | EOD | US |
| Retail Fuel Prices (Location) | Barchart | EOD | US |
| SCB Ethanol Prices | SCB | EOD | Global |
| SCB EU Biofuel Prices | SCB | EOD | EU |
| SCB US Biofuel Prices | SCB | EOD | US |
| Agency | Dataset | Area | Frequency | Description |
| Baker Hughes | Baker Hughes Active Rig Count | Global | Weekly, Monthly | The data set provides weekly and monthly census of the number of drilling rigs actively exploring for or developing oil or natural gas in the United States, Canada and outside North America. |
| Barchart | Futures Activity | Global | Daily | Daily values of global futures volume and open interest in both nominal and notional terms. Notional values of futures volume and open interest allow for comparisons across exchange venues and investment vehicle. Easily compare the value traded between OTC products, ETFs, and futures. |
| Bureau of Labor Statistics | CPI | United States | Monthly | The BLS produces the Consumer Price Index (CPI) for the US which is further categorized by geographic areas and regions. The source produces statistics for the nation, all 50 states, the District of Columbia, Puerto Rico, the Virgin Islands and about 450 metropolitan areas and divisions. |
| CEPEA | CEPEA Agricultural Prices | Brazil | Daily, Monthly | The Center for Advanced Studies in Applied Economics (CEPEA) that conducts research on the dynamics of functioning of agribusiness providing wholesale price indicators for major commodities to help businesses analyze market prices. CEPEA data covers wholesale prices for ethanol, grains, dairy, meat, poultry and cattle. |
| CFTC | Commitments of Traders | United States | Weekly | The Commitment of Traders (COT) report, produced by the Commodity Futures Trading Commission, is a weekly publication that shows the aggregate holdings of different participants in the U.S. futures market. Data is available from the disaggregated report. |
| Energy Information Administration | Natural Gas | United States | Weekly | This report provides users with information about the US natural gas inventories held in underground storage facilities which is updated every week. |
| Energy Information Administration | Petroleum & Other Liquids | United States | Daily, Weekly, Monthly, Annual | The EIA's Petroleum & Other Liquids report provides statistics on crude oil, gasoline, ethanol and other liquid fuels. Information on petroleum prices, crude reserves, production, import and exports, movements and stocks are updated with varying frequencies. |
| Eurostat | EU Energy | European Union (EU) | Annual | The Eurostat Energy data grouping provides information on production, supply, consumption and availability of energy which is further categorized by the sources. |
| Statistics Canada | Canadian Energy | Canada | Monthly, Annual | Monthly statistics on supply and disposition of natural gas, petroleum products, crude oil and electric power selling price index in the Canada. |
| USDA | AMS Ethanol Report | United States | Daily, Weekly | The USDA AMS releases daily and weekly wholesale prices for Distillers Dried, Modified Wet, and Wet grains covering major states and regions across the USA. |
| Content | Frequency | Depth | Options | EOD History | Tick History | Region | Country |
| CME Group - CBOT | Realtime | L2 | Available | 1978-03-03 | 2008-05-04 | Americas | US |
| CME Group - CME | Realtime | L2 | Available | 1978-03-23 | 2008-05-05 | Americas | US |
| CME Group - Nymex | Realtime | L2 | Available | 1978-05-15 | 2008-05-05 | Americas | US |
| Dalian Commodity Exchange | EOD | Last | Available | 2004-01-02 | - | APAC | China |
| ICE Endex | Realtime | Last | Available | 2010-08-16 | 2021-06-04 | EMEA | Netherlands |
| ICE Europe - Commodities | Realtime | L2 | Available | 1989-07-24 | 2008-05-05 | EMEA | United Kingdom |
| Shanghai - INE | EOD | Last | - | 2013-09-18 | - | APAC | China |
| Shanghai Futures Exchange | EOD | Last | Available | 2002-05-08 | - | APAC | China |
| Tokyo Commodities Exchange (TOCOM) | EOD | Last | - | 1992-01-06 | - | APAC | Japan |
| Zhengzhou Commodity Exchange | EOD | Last | Available | 2005-05-09 | - | APAC | China |
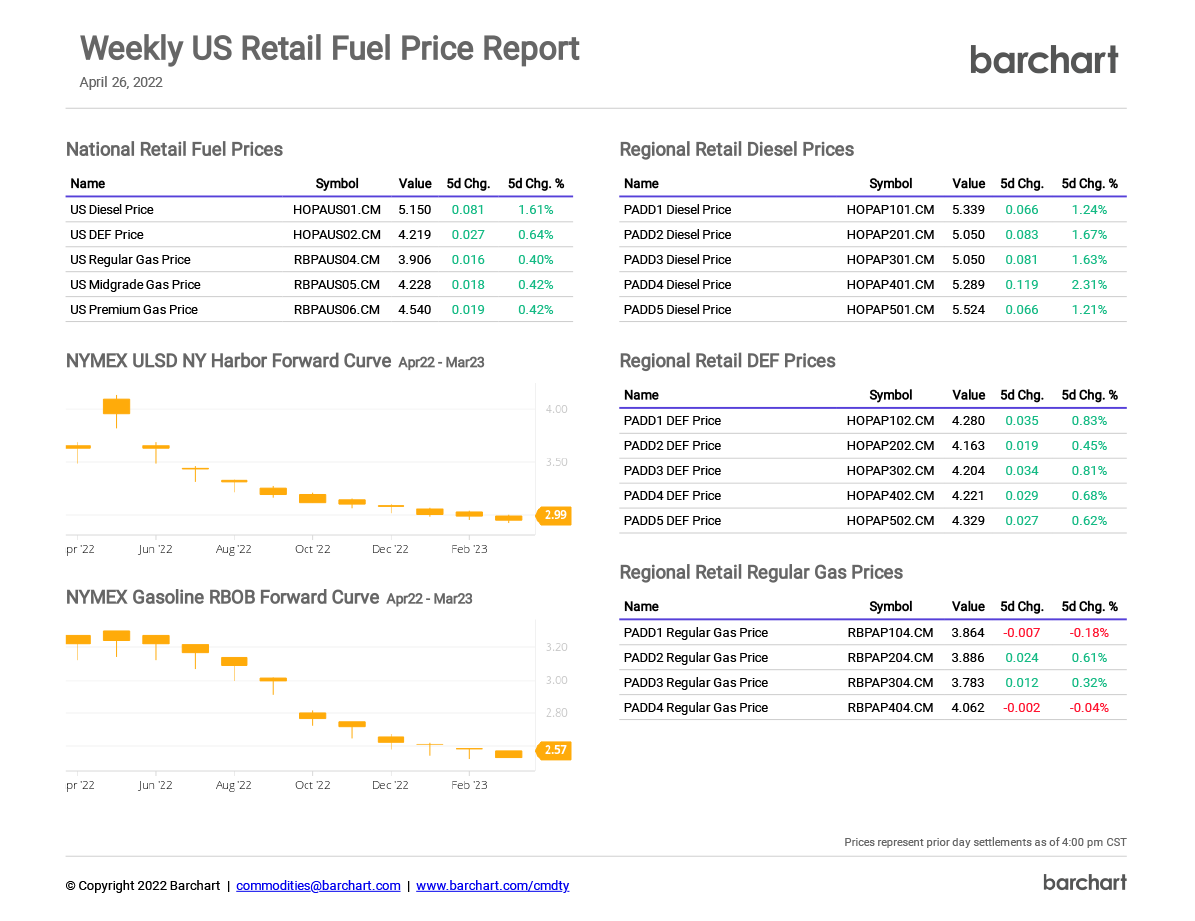
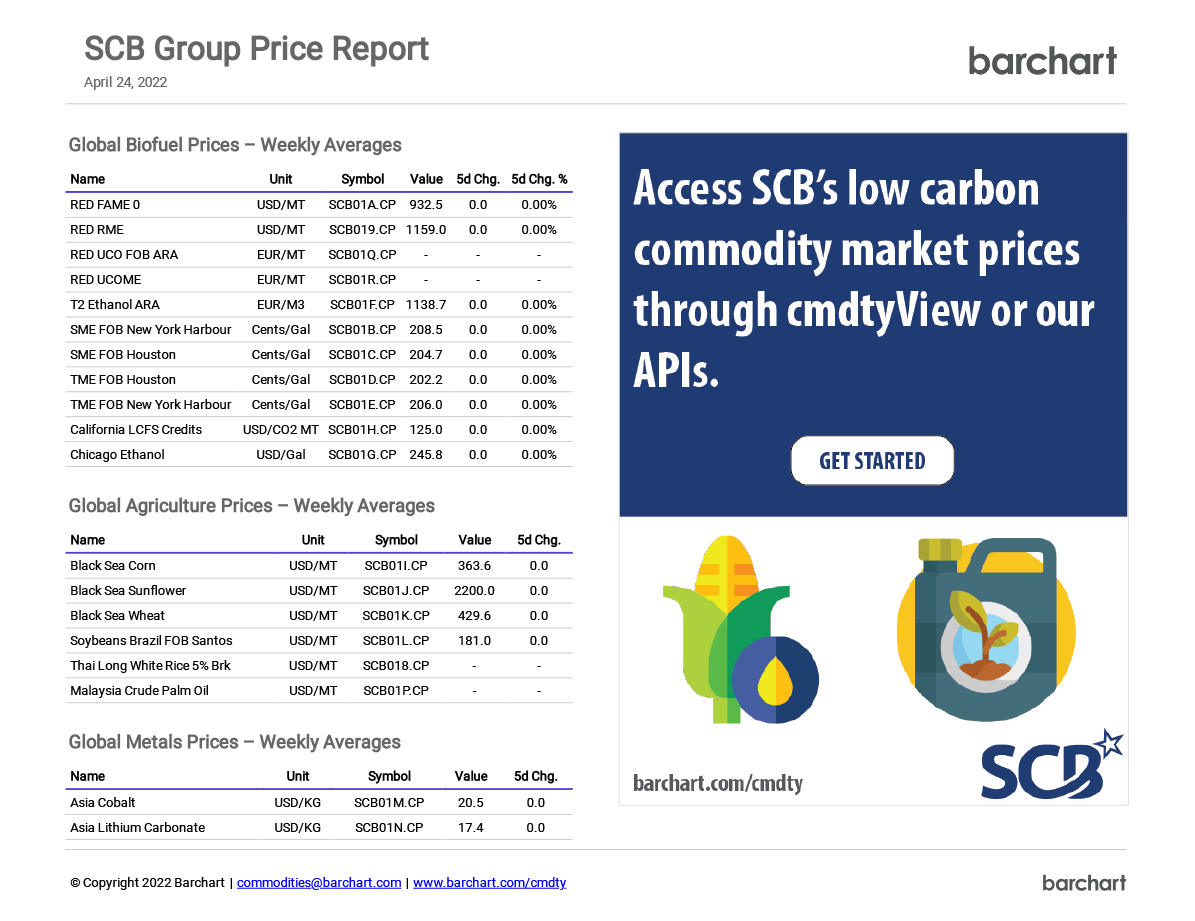
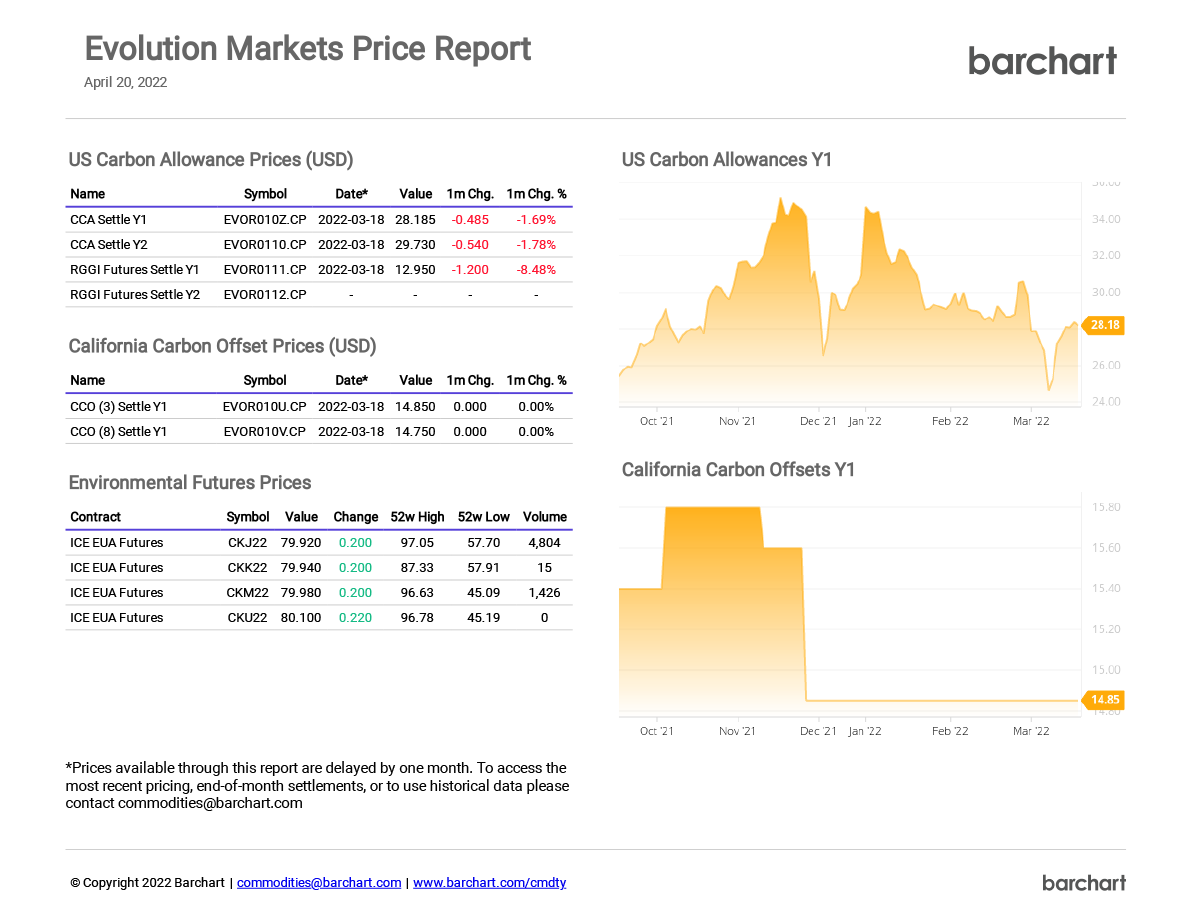
Free Commodity Reports
Get access to our proprietary price reports to keep a pulse on global commodity markets.
Start working smarter with better data today!
In the Barchart Commodities blog More

ZE Power
How ZE Power Delivers Reliable Energy Data to Their Clients
Learn More ›
Rigzone
How Rigzone Keeps Their Audience Informed With Oil Price Charts and Data
Learn More ›
Oilytics
How Oilytics Powers Its Platform with Relevant, Accurate Exchange Information and Fundamental Data
Learn More ›Explore Barchart’s Commodity Pricing Network
Access data from the leading contributors in Ag and Energy. Available over API or through cmdtyView.
Free Commodity Reports
Get access to our proprietary price reports to keep a pulse on global commodity markets.


